Tellusant Resources
We publish leading-edge insights and thoughts about management science, strategy development, strategic forecasting, urban and rural economics, and more.
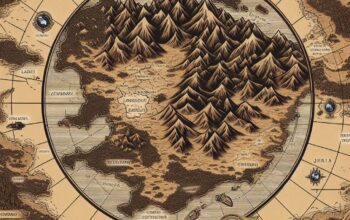
Tellusant Maps Library
Tellusant generates an immense number of maps for our cloud-based solutions. Our maps library has some useful examples.

Tellusant Sways Library
We use Microsoft Sway to create punchy, cross-platform presentations. They are typically to introduce a topic without too much detail. The Tellusant Sways Library contains the most important presntations.
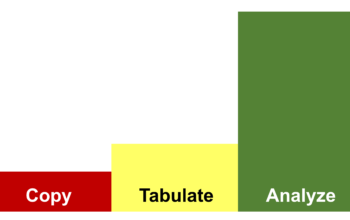
Copy — Tabulate — Analyze
Here is advice for current and future business analysts at large corporations or consulting firms. Your most important goal is to add value. This means thinking long and hard about whether you copy, tabulate or analyze information. Only analysis truly adds value. Follow the copy-tabulate-analyze framework. We think of information manipulation as a three-level hierarchy. […]
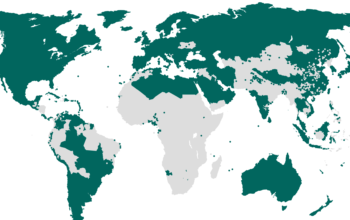
Global Middle Class Growth 2000-2040
This video shows the global middle class growth from 2000 till 2040. It is based on our TelluBase database.

Global Water Intake Calculator
Tellusant often works with beverage companies participating in categories from milk to beer. How much water the human body needs is a fundamental metric to quantify when analyzing market opportunities. We therefore developed the Tellusant Global Water Intake Calculator.

Tellusant Product Architecture
What makes Tellusant unique? Our competitive advantage comes from integrating several capabilities in the Tellusant product architecture. We are not a company building BI software. Nor do we sell data. We provide strategic solutions leveraging our product architecture.

Pricing Aligned with Consumer Economics
PACE (Pricing Aligned with Consumer Economics) is part of our roll-out of web products happening over the next few weeks and months.

Latent Demand Estimator PACE Screenshots
Flip through screenshots of our PACE App. They give an impression of the capabilities.
PACE—Latent Demand Estimator Video
Do you know who, where, and when your consumers are buying your products? Globally? By city? In 2027?