![]()
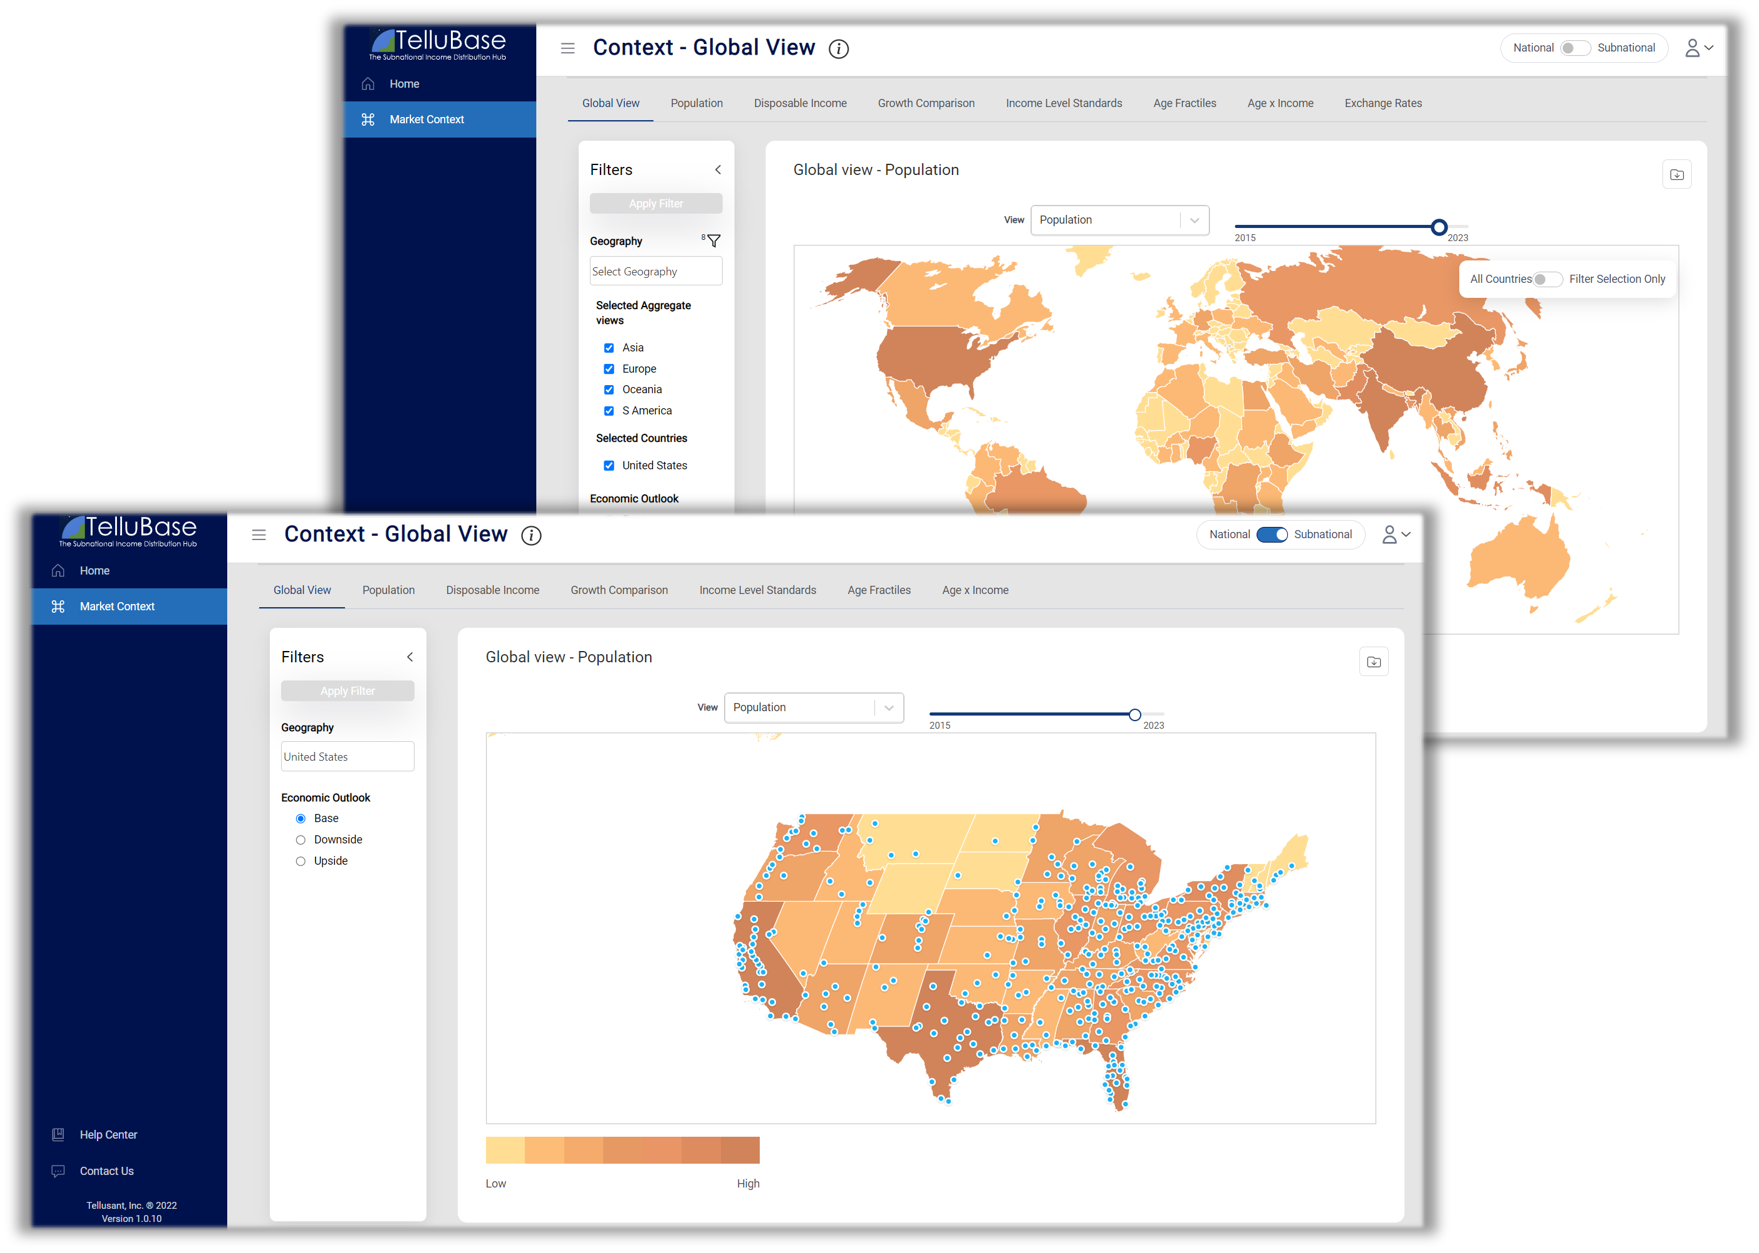
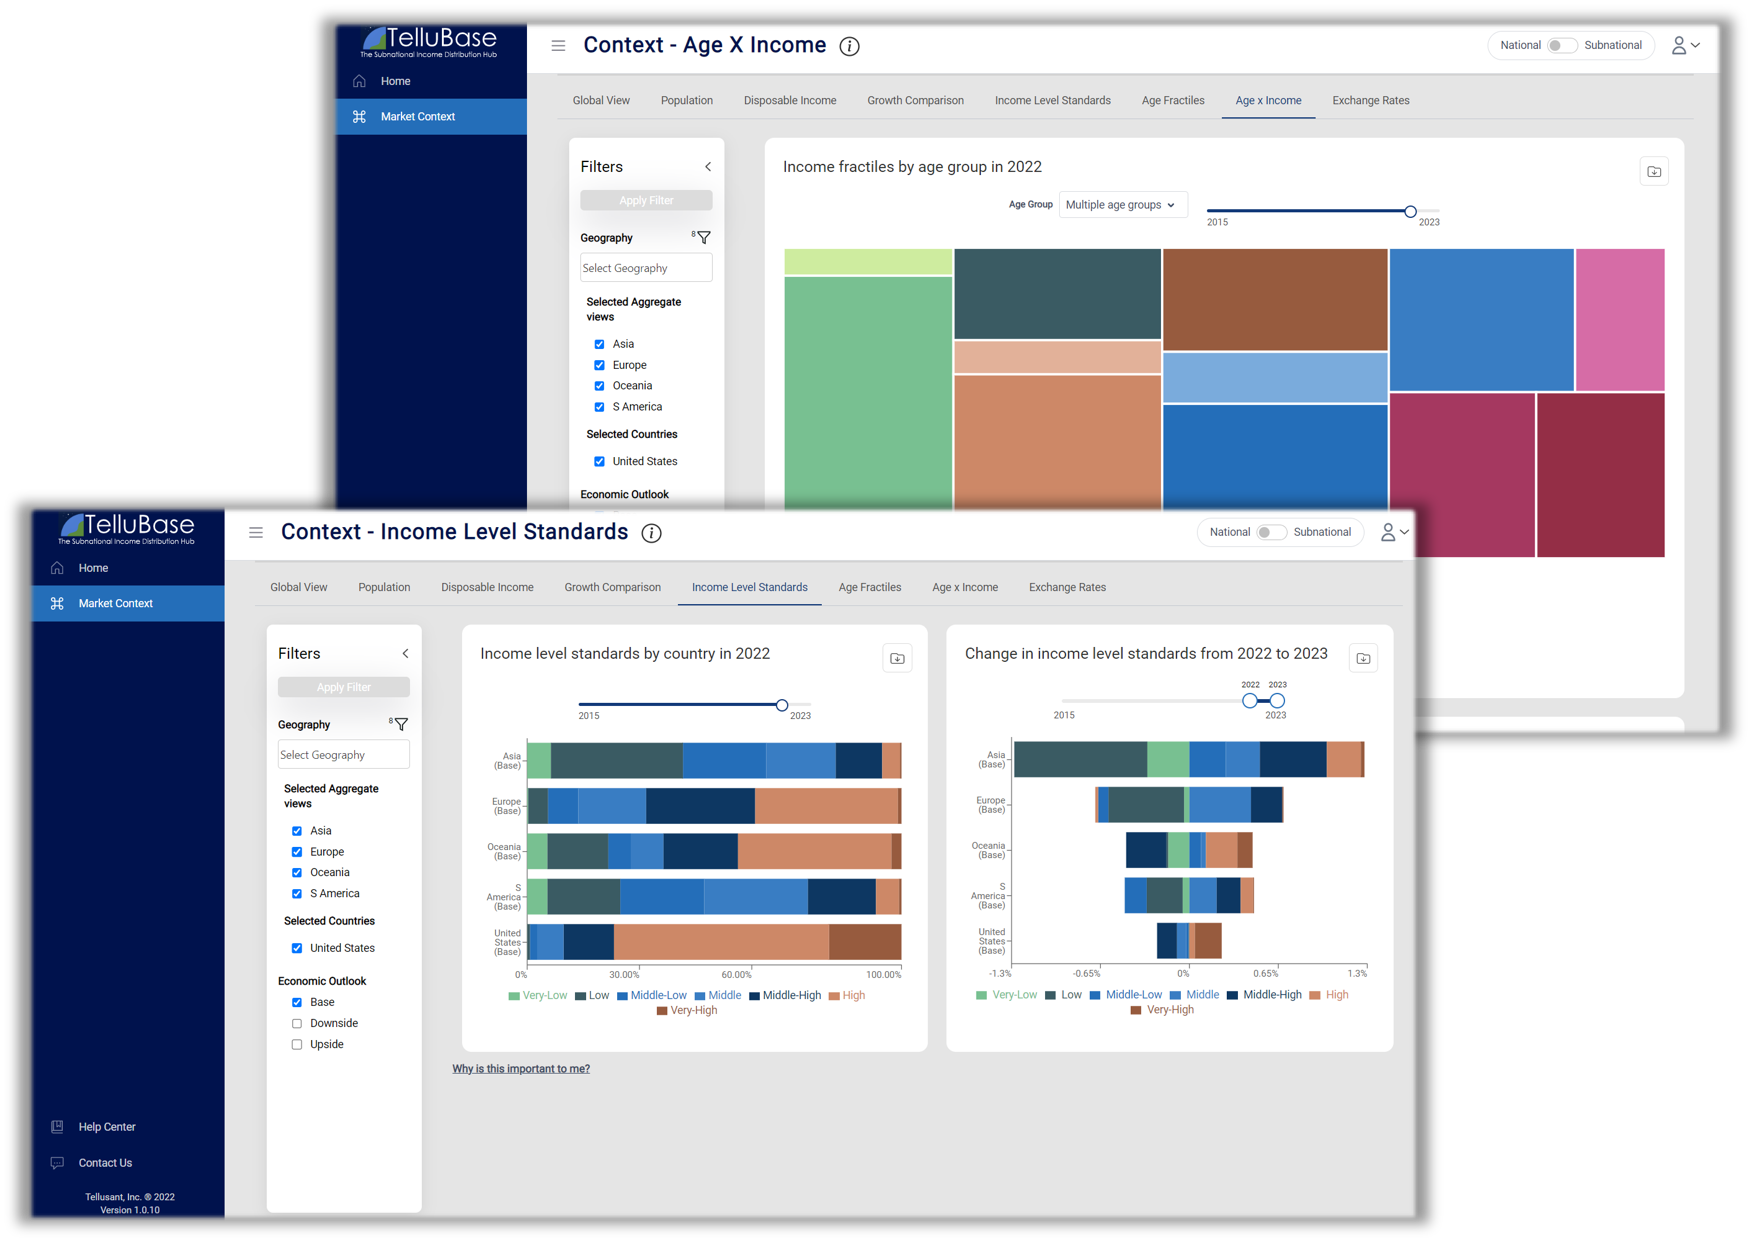
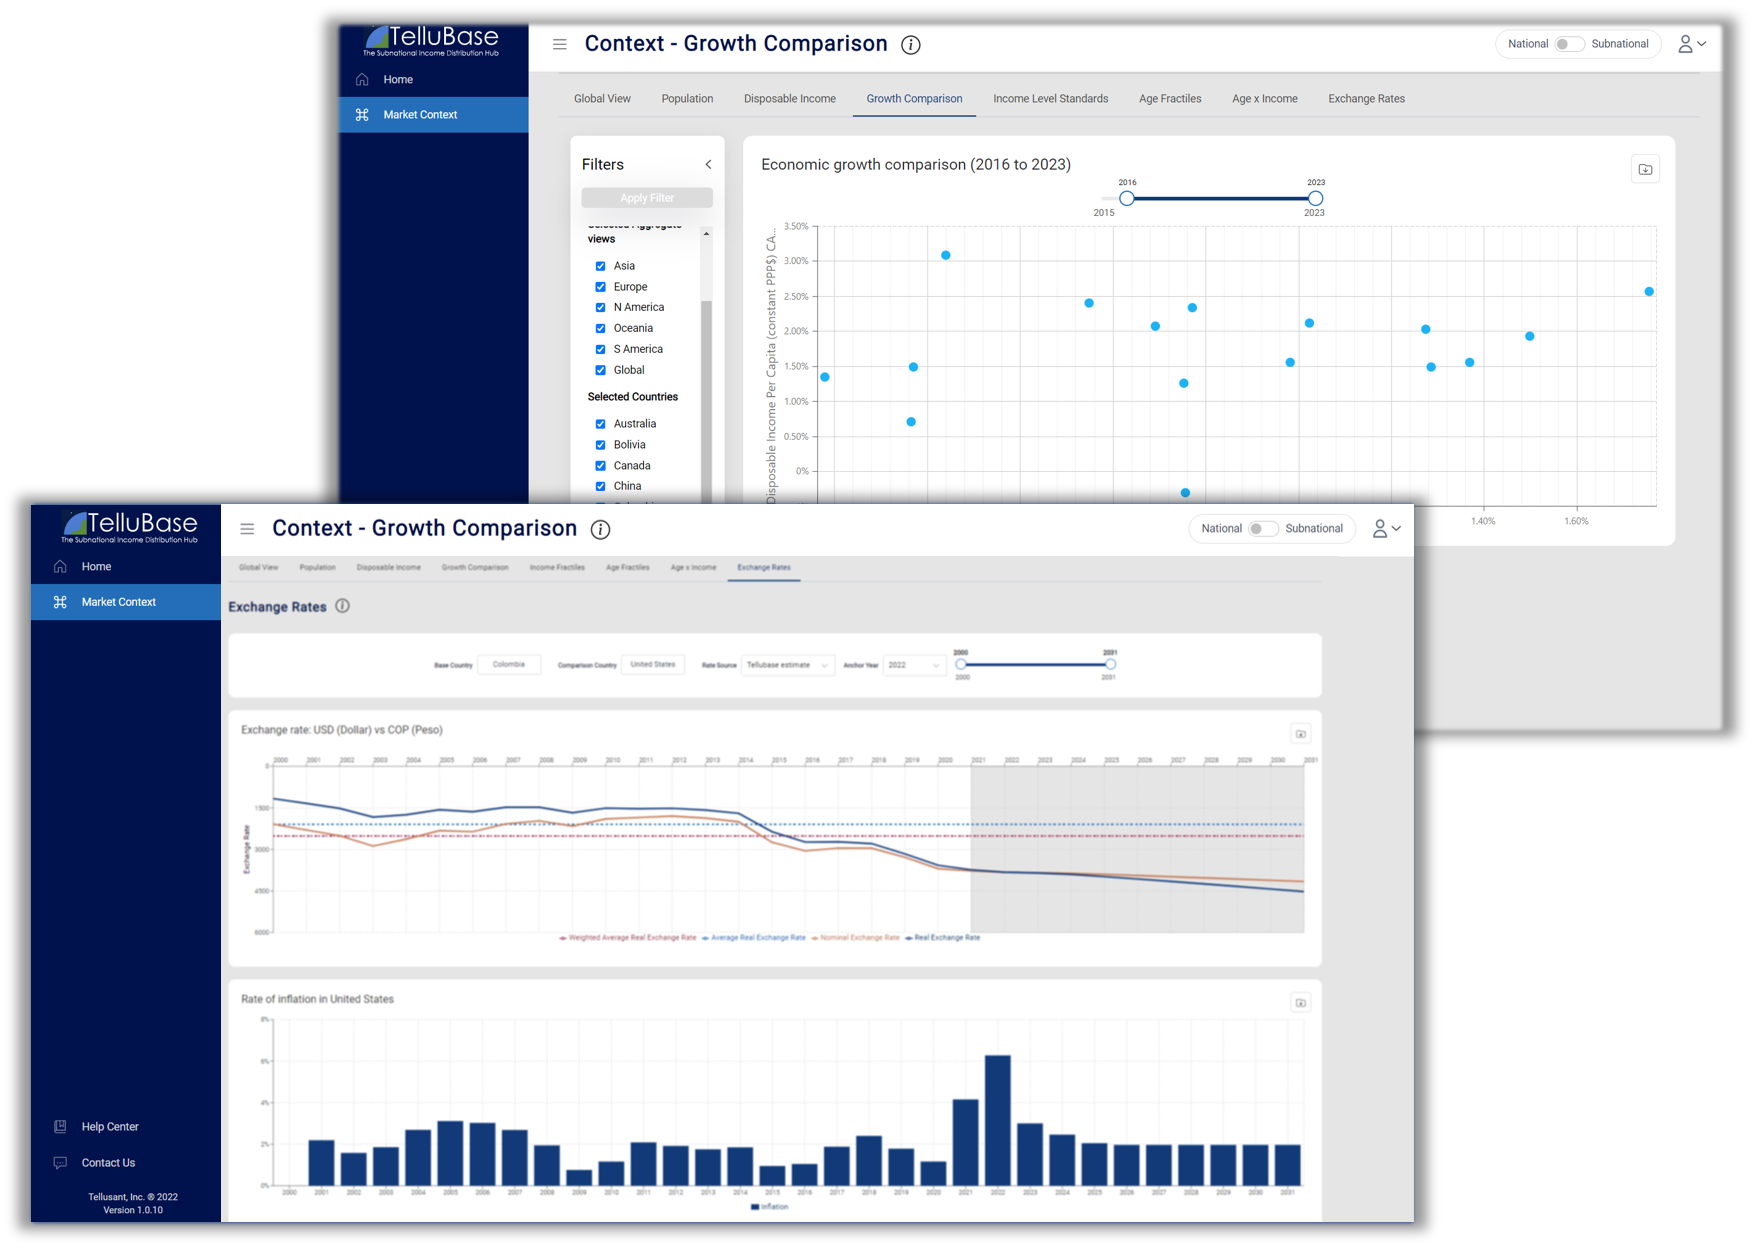
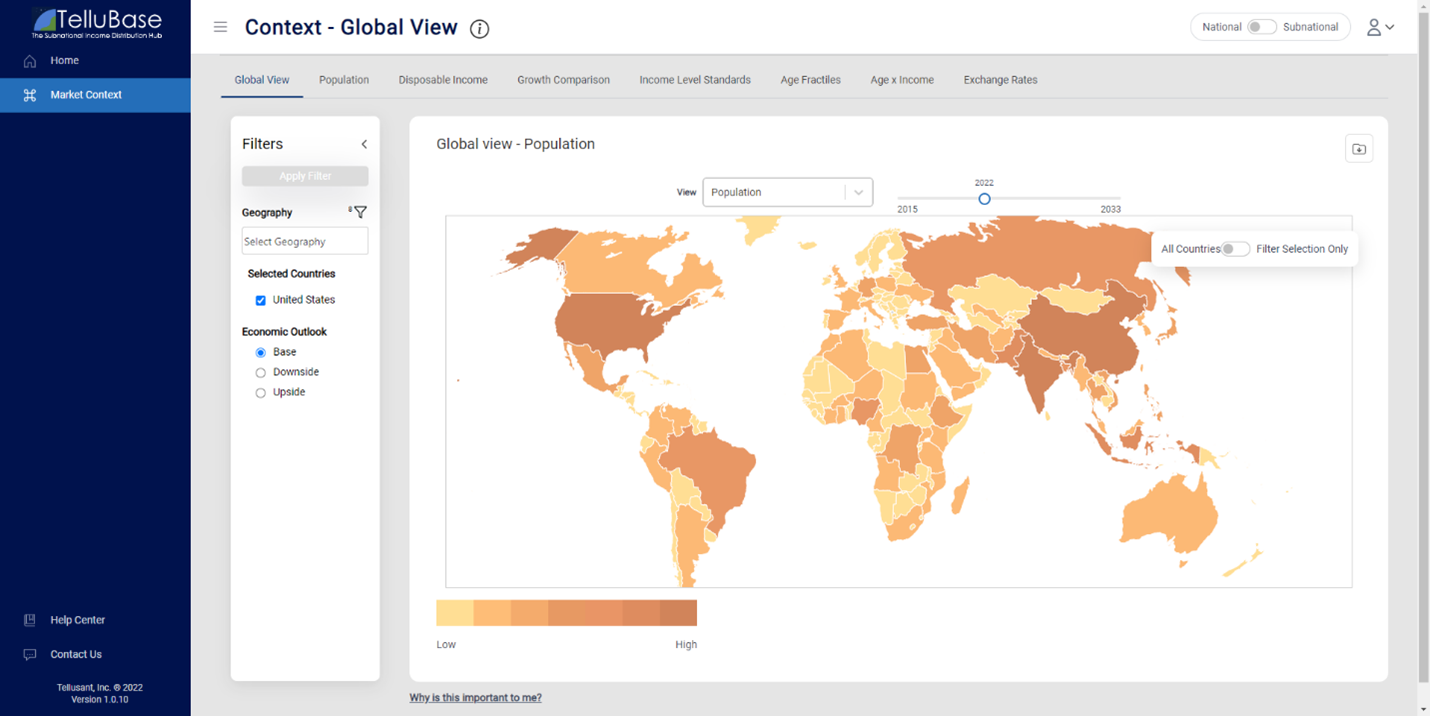
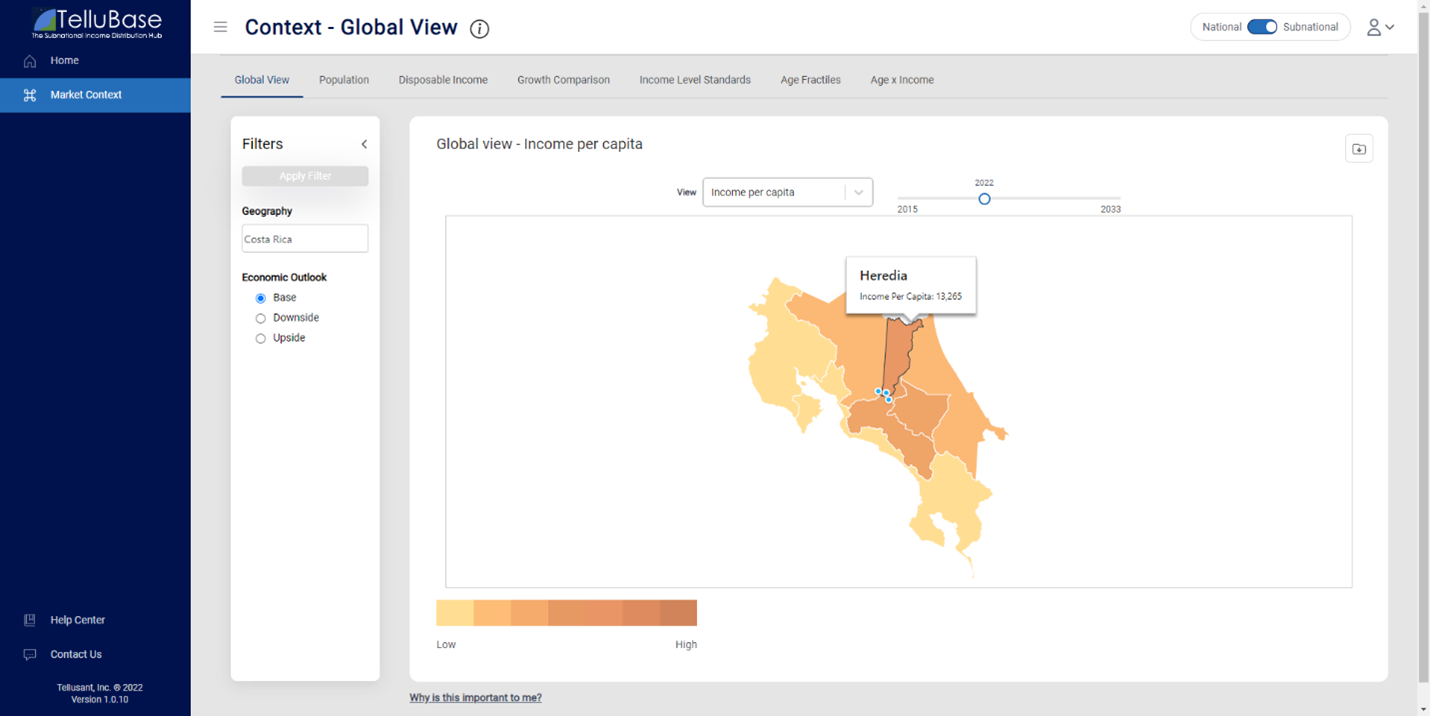
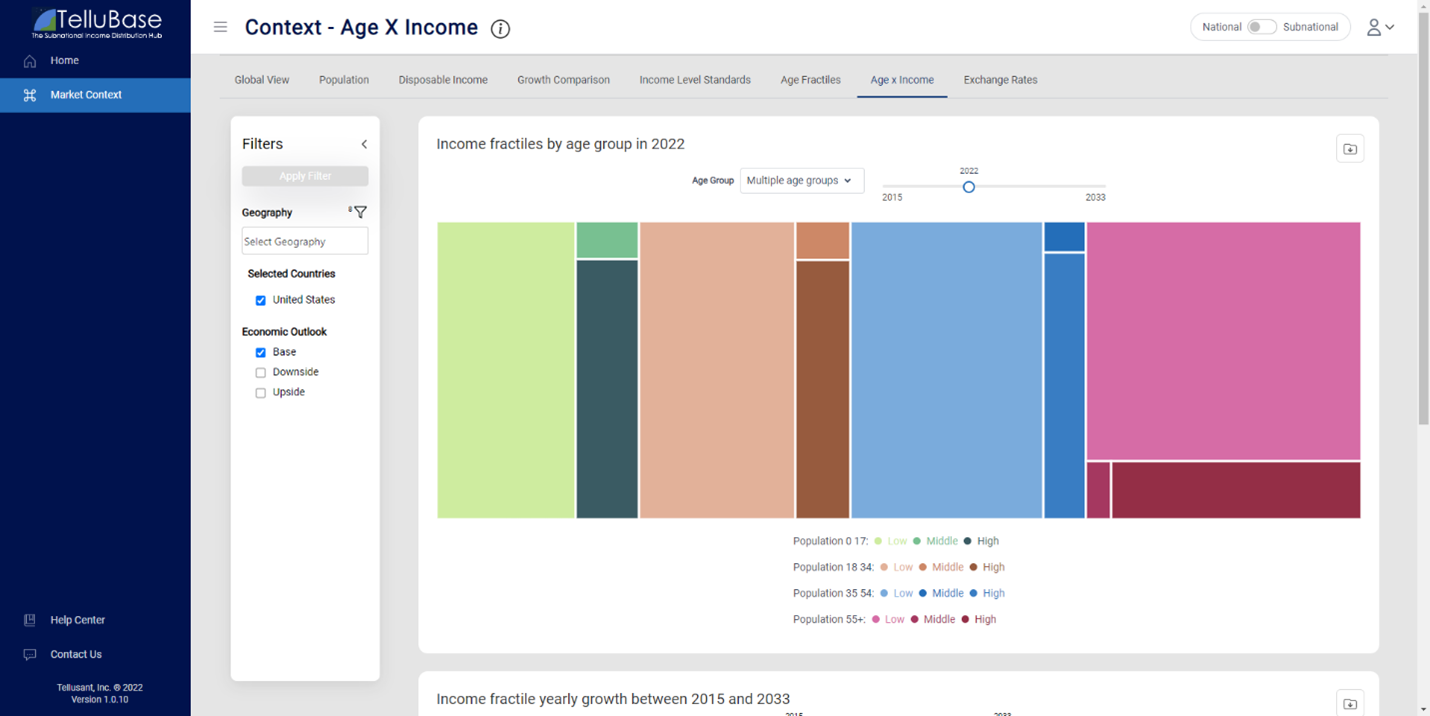
TelluBase is the external information hub every company and organization needs. It is the only database in world that breaks down consumer groups by classes and age level across countries, subnational divisions, cities, and years.
This unique database allows you to understand and quantify consumer economics at a granular level beyond what is possible today.
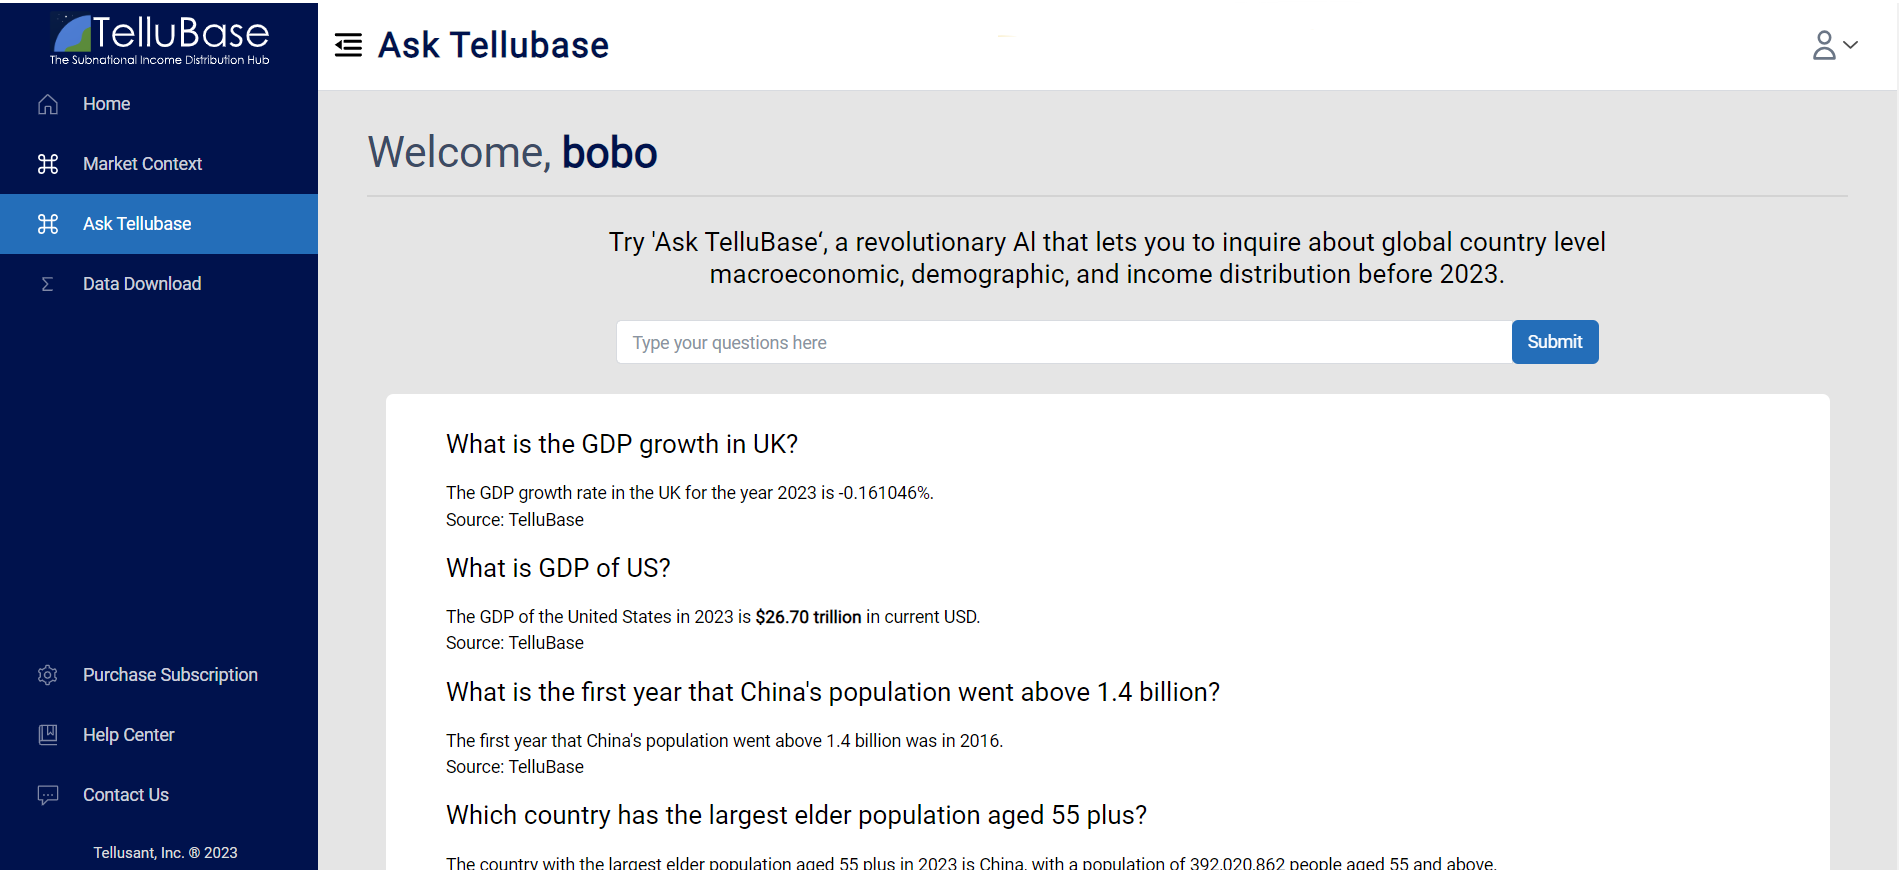
Now introducing Ask TelluBase, an GPT-like AI that can answer any questions using TelluBase data.
With TelluBase your perspective on the world will change forever. It is truly the world as no one has seen it before.
TelluBase was developed from more than 30 years of effort to build the complexity for this revolutionary information.
Contact us to learn more
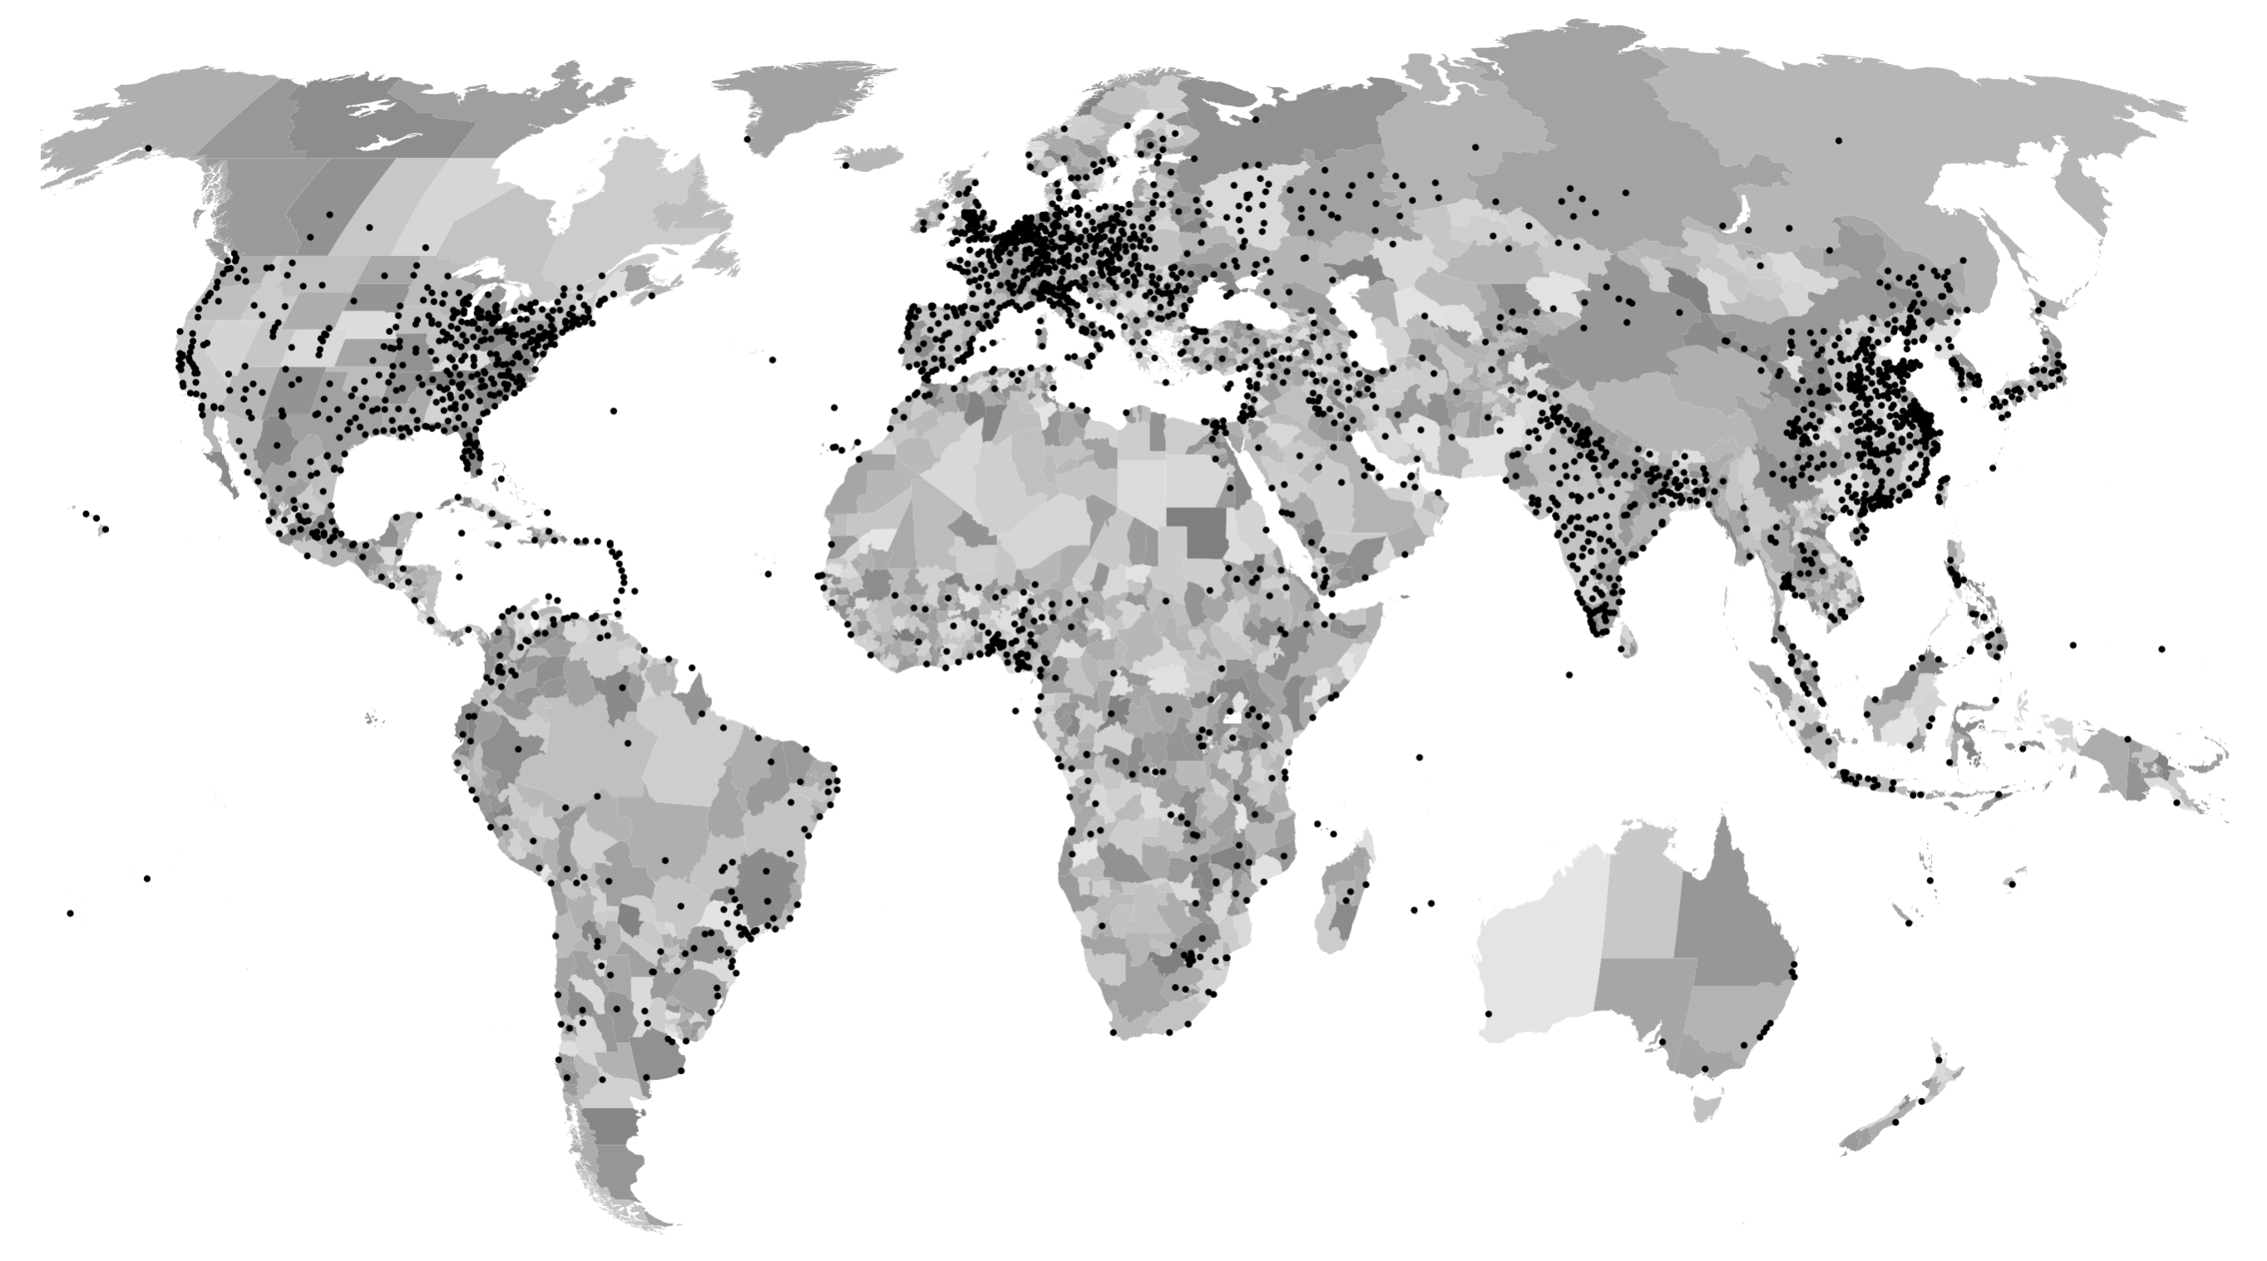
 Fully harmonized global data
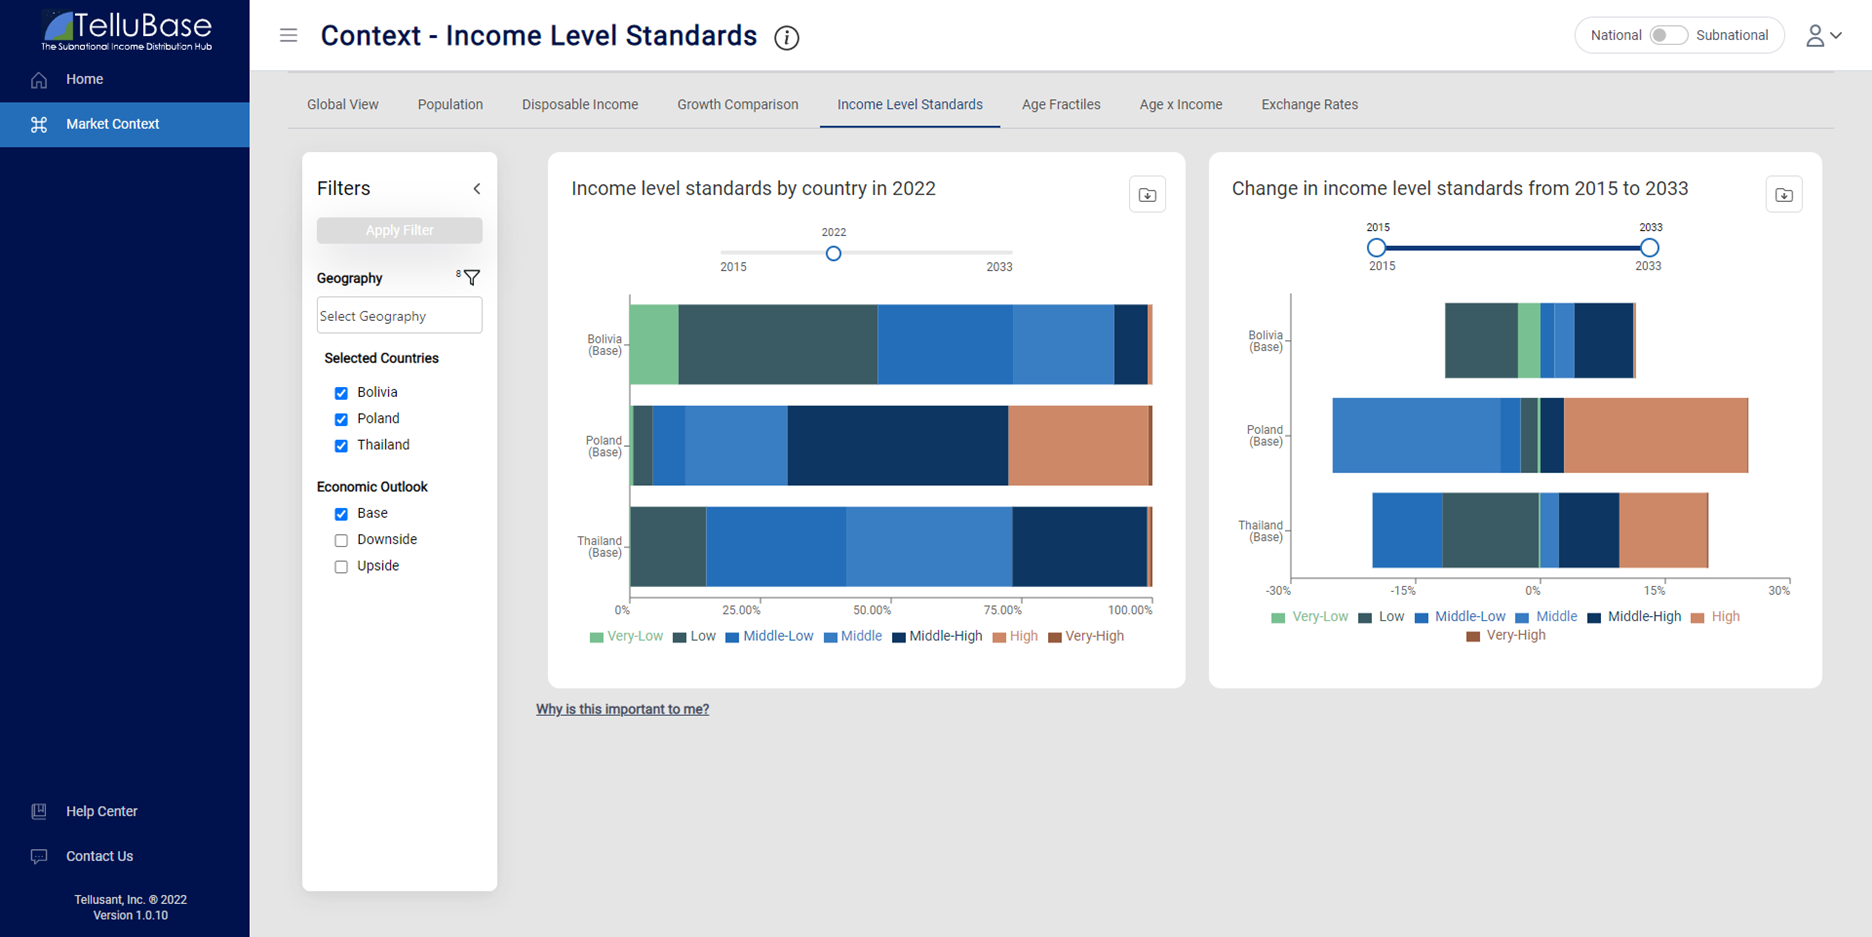
 Customizable consumer classes
 Easy to use platform