Copy — Tabulate — Analyze
- Posted By:
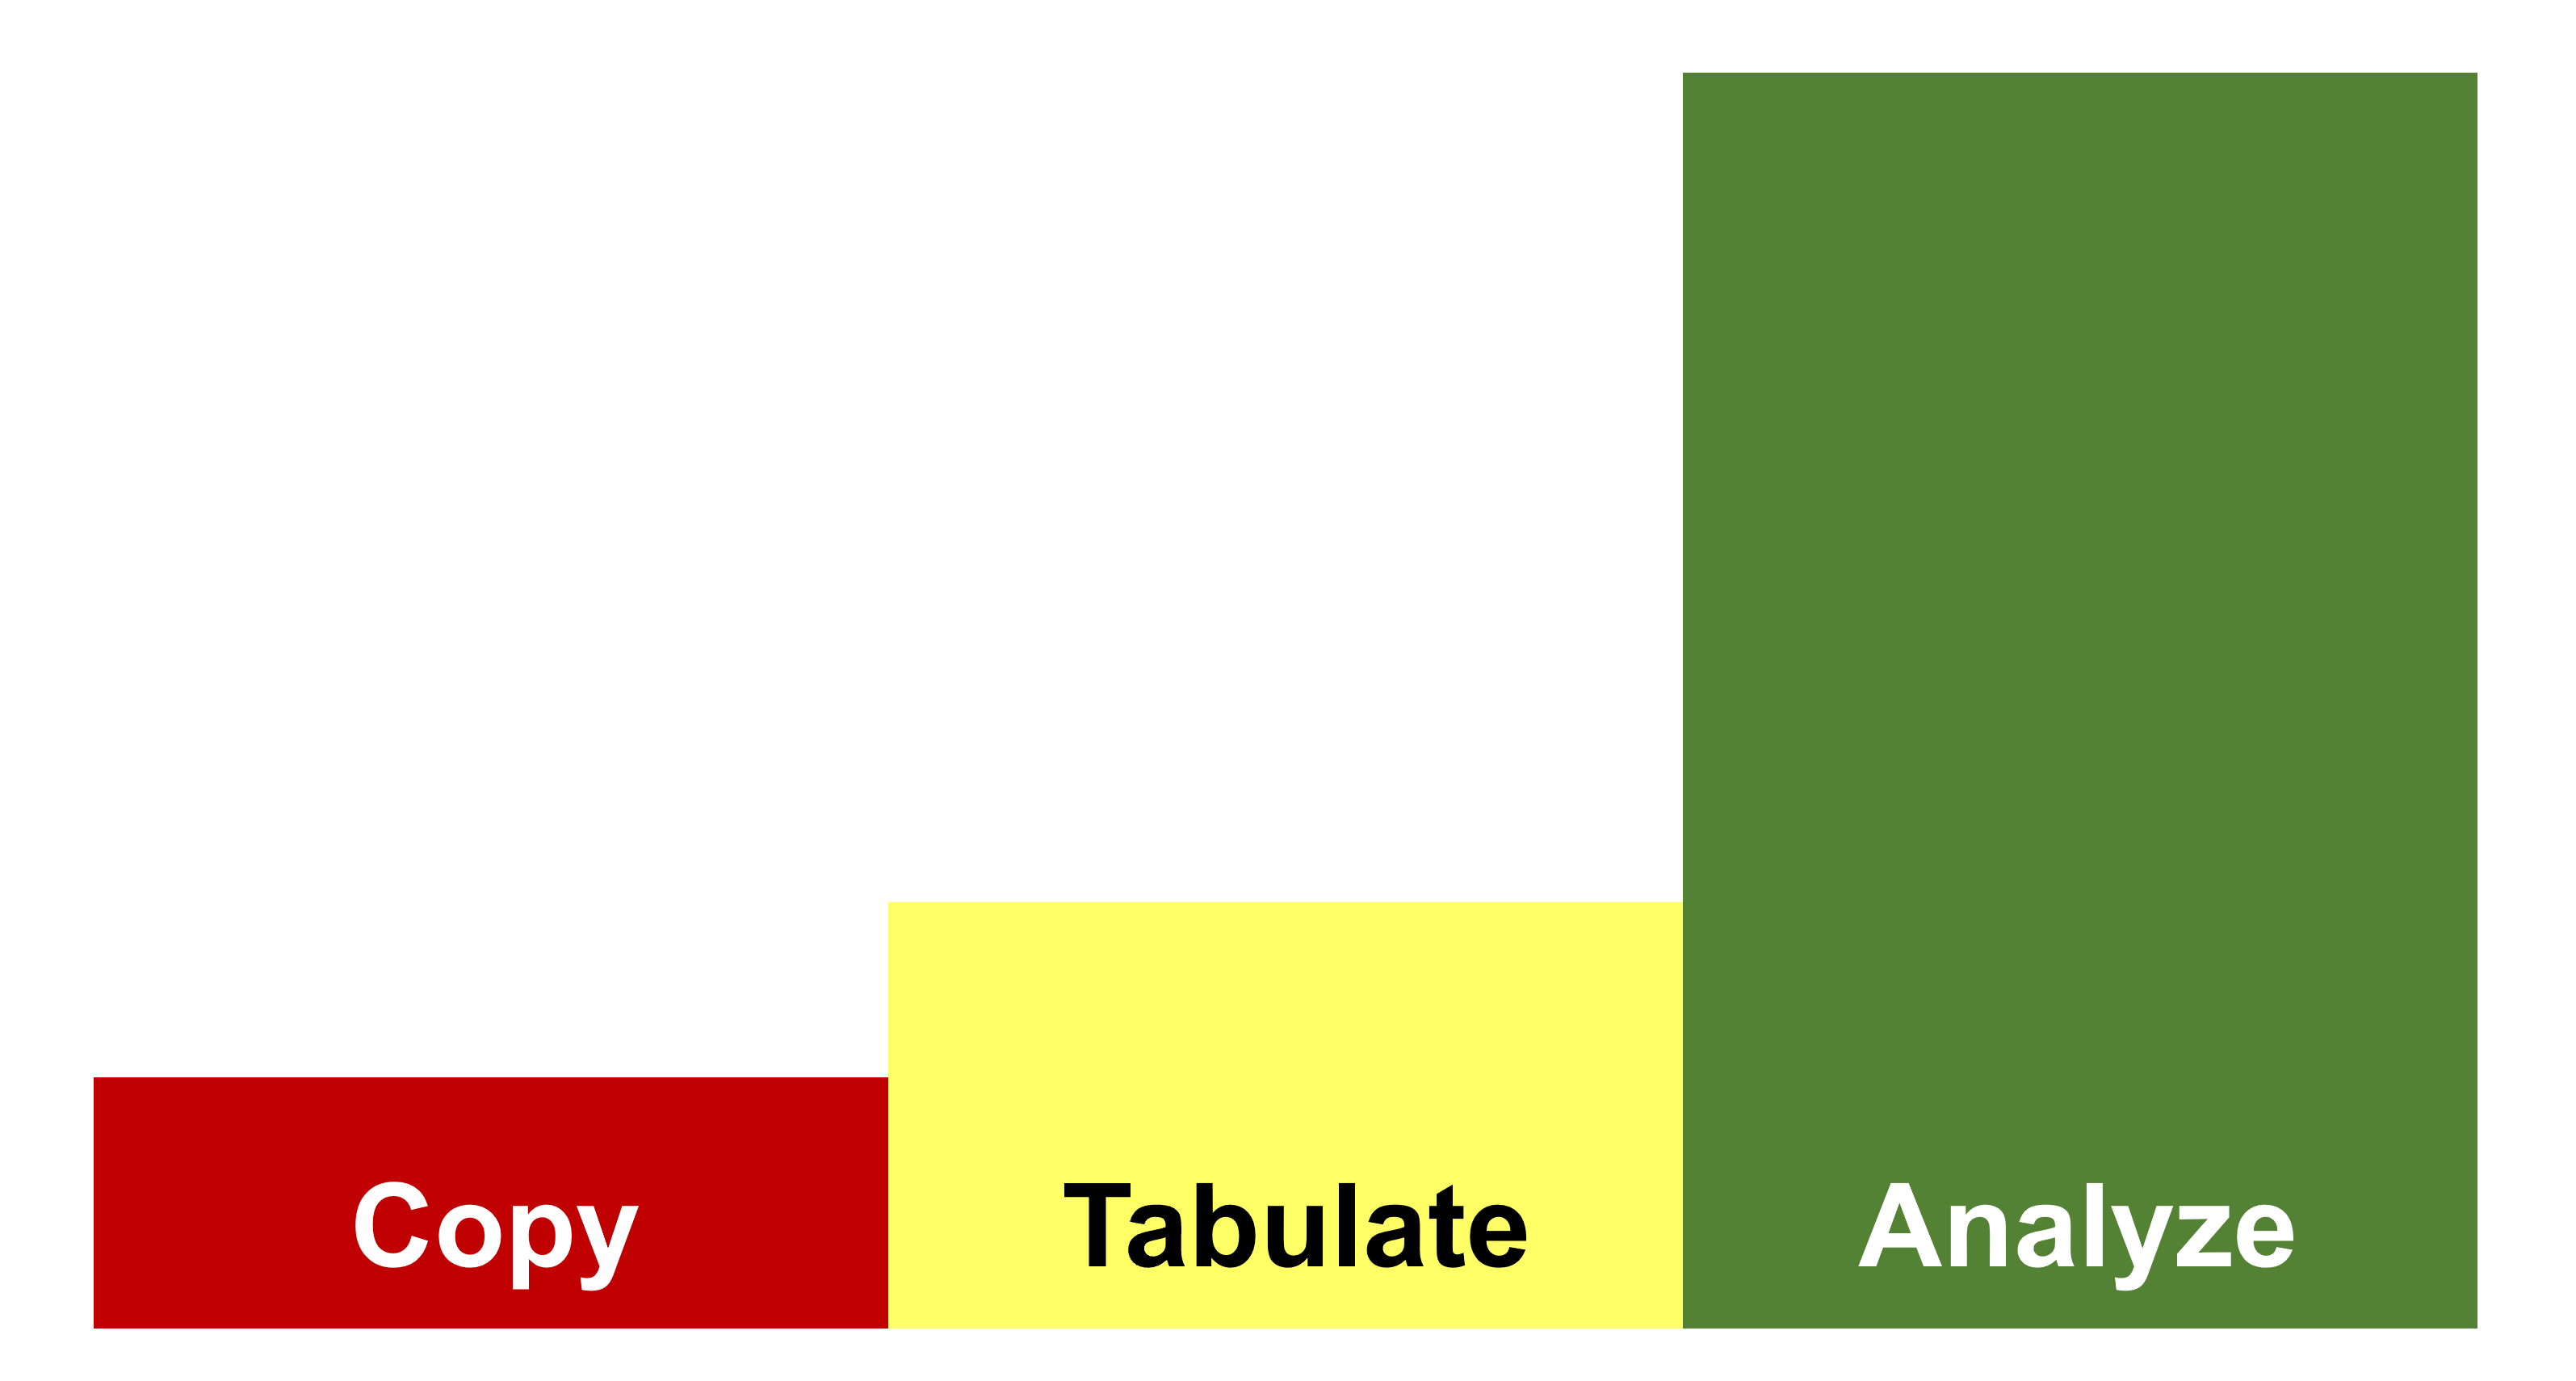
Here is advice for current and future business analysts at large corporations or consulting firms. Think through the copy — tabulate — analyze framework.
Copy — Tabulate — Analyze
Your most important goal is to add value. This means thinking long and hard about whether you copy, tabulate or analyze information. Only analysis truly adds value.
We think of information manipulation as a three-level hierarchy.
Copy
This is the simplest form of handling information. In the old days it was done with a Xerox machine. Today, data is usually replicated in a new spreadsheet. That is, exactly the same information as in the original data source is presented, perhaps with a spiffier graphic.
There is little value in this, but sometimes it is useful when basic facts need to be presented. An analyst who does this for a living, or a manager who asks for only this type information will not be long lived in the organization.
Here is an example of a copy we made of a graph* in the Washington Post.
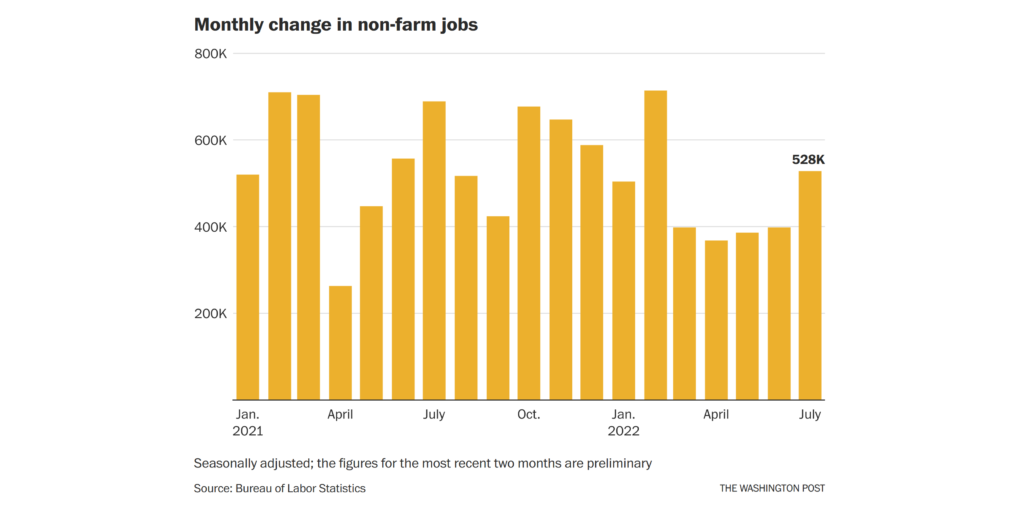
The original is a dynamic graph, so my copy even reduces the value of it.
Tabulate
The by far most common form of information manipulation is tabulation. Again, it is a trivial task.
As a tabulator, you take existing information and cut it in a different way. For example, your existing data has sales and profit in two columns. You create a new ROS column by dividing profit by sales. There is no analytical task in this, just a simple division.
Another example is if you have income by county and aggregate it up to the state level and then present a bar chart. There is no analysis in this, just a simple summation and tabulation.
Most analysts do tabulations but believe they are analyzing. Tabulation certainly can be useful in presenting basic facts. But it does not reveal unknown patterns and as such adds marginal value to the organization.
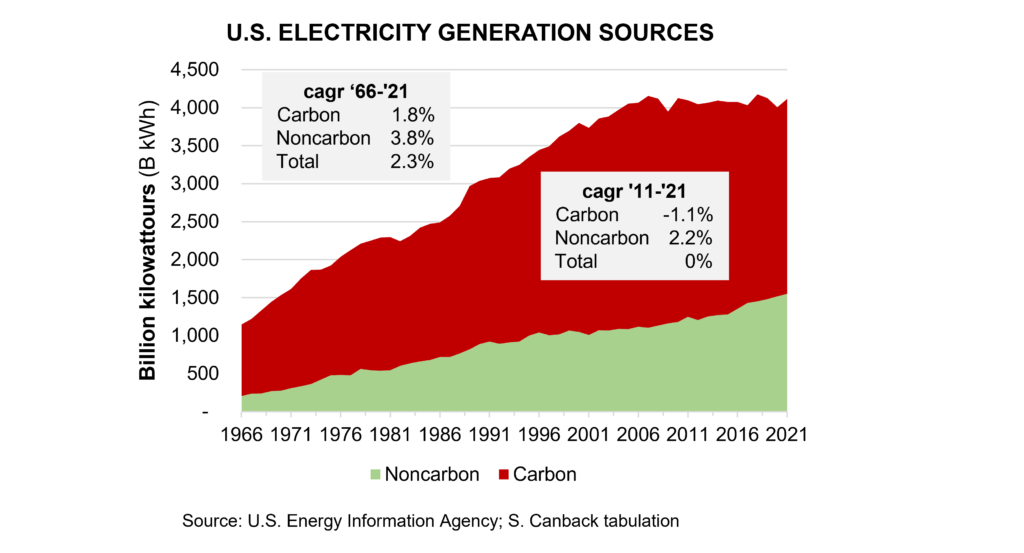
Here is an example of a tabulation we did, presented in an area graph. It is a tabulation because the EIA had done the analysis. We just had to plot two time series and calculate compound annual growth rates. This does not qualify as analysis.
Analyze
Three characteristics are the hallmark of analysis:
- It uses high order cognitive skills
- It can be quantitative or qualitative data
- When quantitative, it uses it uses statistical methods or calculus, and combines different datasets
An example of analysis is if you want to estimate regional sales of a category within a country.
You have one dataset with global income distribution data and a global dataset of category data, both at the national level. Further, you have regional income data for the country. You also know, from visits to the country, that the category is mainly sold in modern supermarkets, so you collect supermarket geocodes and square meter size. From this you then build a statistical that informs the analysis.
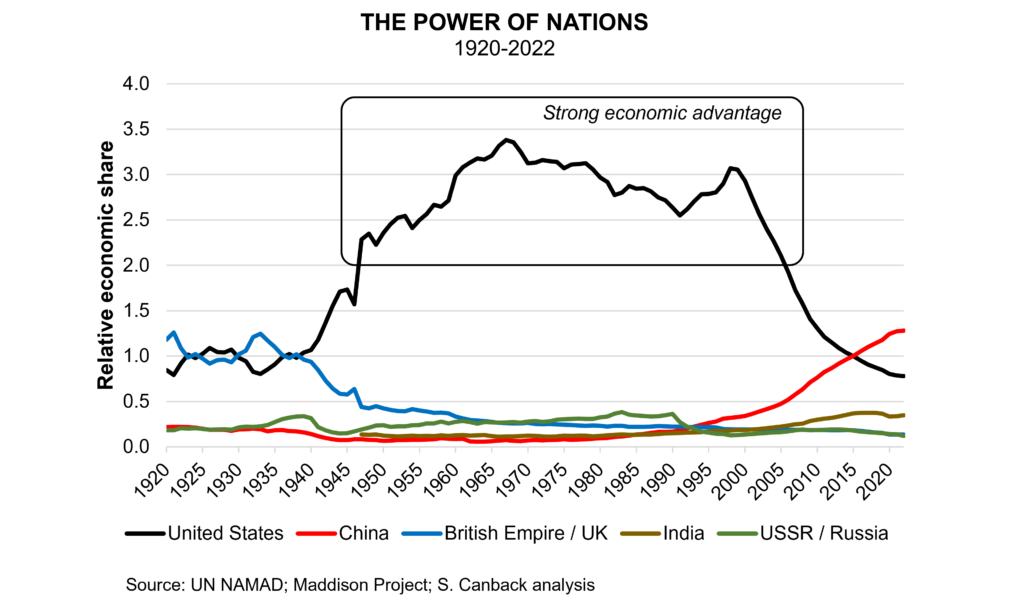
Here is an example of a genuine analysis we did recently. We say genuine because a) the long time series (1921–2016) did not exist until we created it; b) we had to figure out how the British Empire and the USSR evolved over time and estimate GDP for their component parts; and c) we had to know how to calculate relative market share and how to define it for a country, as we borrowed the concept from micro economics.
Conclusion
As a business analyst, make sure you do not just do the trivial stuff. Make sure you have the skills to truly analyze the issue at hand. After all, it is called business analyst, not business copier or business tabulator.
* Which in itself is an example of a tabulation
 English
  Español de México