Category: Products

A Quick Tour of TelluBase
June 3, 2024
Do you know who, where, and when your consumers are buying your products? Globally? By city? In 2027?

Creating Robust Long-Term Forecasts
May 4, 2024
This short document describes how sophisticated and careful our long-term predictive models are and allows readers to glean under the hood.

Tellusant’s Universal Profit Equation (TUPE)
March 21, 2024
The most important decisions in times of high inflation are pricing related. Here we describe methods for how companies should optimize pricing…
Introducing ‘Tellusant Public Service Series’
January 17, 2024
We have started providing free TelluBase data to select public data sources.These are small, but important, subsets of the full product.

The Triple-A Method for Market Sizing
December 16, 2023
Quantifying market opportunities requires clear definitions that are the same between and within countries. The Addressable – Available – Actual market sizing method provides this.

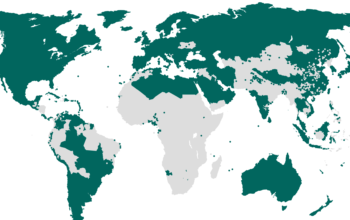
TelluBase Geographic Coverage
August 1, 2023
See a map of the 2,600 cities and 2,500 subdivisions Tellusant covers. The map uses the Canback Map Projection©, moving continents and countries to make best use of screen space.
Middle Class Evolution 2000-2040
February 24, 2023
This video shows how the global middle class evolves from 2000 till 2040. It is based on our TelluBase dataset.

Introducing Tellusant’s Water Intake Calculator
January 23, 2023
Tellusant often works with beverage companies covering categories from bottled water to beer. A fundamental metric to quantify when analyzing market growth is how much water the human body needs. We have therefore developed the Tellusant Water Intake Calculator.

Tellusant Product Architecture
January 10, 2023
What makes Tellusant’s products unique? Our competitive advantage comes from integrating several capabilities. We are not a company building BI software. Nor do we sell data. We provide strategic solutions.
Introducing PACE
November 20, 2022
We are rolling out our latest product over the next weeks and months. This is an advance notice describing some of the use-cases.

See PACE Screenshots
November 10, 2022
Flip through screenshots of our PACE App. They give an impression of the capabilities.

Introducing PACE—Pricing Aligned with Consumer Economics
October 14, 2022
Do you know who, where, and when your consumers are buying your products? Globally? By city? In 2027?

The All-Importance of Income Elasticity (Illustrated with Automotive Example)
September 29, 2022
If a company does not use dynamic income elasticities applied to expected income income growth when predicting the future, it has nothing..

Pricing Mechanisms for Managing Through Inflation
September 20, 2022
[8092 views] In inflationary times, consumers are adjusting their price beliefs. Here is Tellusant’s holistic perspective on FMCG pricing mechanisms.

How to Inflation-Adjust Corporate Revenue Streams
August 23, 2022
How fast have companies grown over the last year? The real (inflation-adjusted) growth rate is the only way to answer this…

Where in the World is the Market?
August 2, 2022
Sizing and predicting global consumer goods markets is difficult. This academic article in Problems and Perspectives in Management by Tellusant’s chairman gives the theoretical underpinning for how our products solve the problem. 10 pages.

What to Do When Inflation Hits — CEO Actions (5/5)
July 28, 2022
Key personnel involved in strategy, from directors to executives Private equity firms supporting portfolio companies…
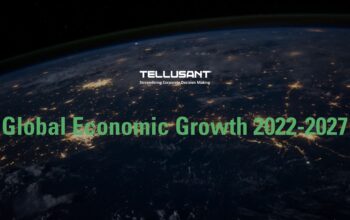
Global Economic Growth 2022-2027
April 24, 2022
See the current economic growth expectations in a Sway presentation. Based on April 2022 forecasts.
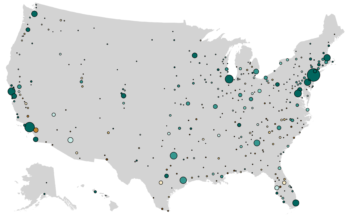
U.S. Cities: Population and Affluence
March 14, 2022
This 24 seconds video shows affluence for 384 U.S. cities by octile in 2020. It starts with the poorest and ends with the richest. Watch it full screen.

Tellusant – Strategy Guide: The Modern and Scientific Synthesis for CEOs
November 18, 2021
Tellusant’s strategy guide gives a rigorous view of how to define strategic planning and how to optimize the work flow to create the plans. 22 pages.
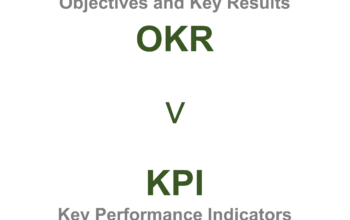
OKR or KPI?
December 24, 2020
OKR or KPI? Objectives and Key Results is common in tech, while Key Performance Indicators is common in consumer goods and other traditional industries.