Resources
We run the Tellusant Innovation Center of Excellence with leading-edge insights and thinking about management strategy

The Triple-A Method for Market Sizing
August 16, 2024
Quantifying market opportunities requires clear definitions that are the same between and within countries. The Addressable – Available – Actual market sizing method provides this.

A Quick Tour of TelluBase
June 3, 2024
Do you know who, where, and when your consumers are buying your products? Globally? By city? In 2027?

Tellusant’s Universal Profit Equation (TUPE)
March 21, 2024
The most important decisions in times of high inflation are pricing related. Here we describe methods for how companies should optimize pricing…

Consumer Impact of Pricing
February 1, 2024
How has consumer demand been impacted by price increases? Have those price increases been above inflation? Read our latest white paper which removes the haziness.

Tellusant Public Services Library
January 17, 2024
We are providing free TelluBase data to select public data sources.These are small, but important, subsets of the full product.

Tellusant Sways Library
October 9, 2023
We use Microsoft Sway to create punchy, cross-platform presentations. They are typically for introducing a topic without too much detail.

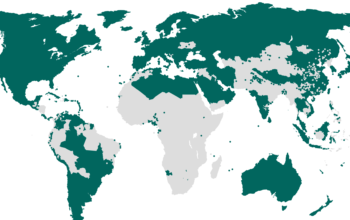
TelluBase Geographic Coverage
August 1, 2023
See a map of the 2,600 cities and 2,500 subdivisions Tellusant covers. The map uses the Canback Map Projection©, moving continents and countries to make best use of screen space.
Middle Class Evolution 2000-2040
February 24, 2023
This video shows how the global middle class evolves from 2000 till 2040. It is based on our TelluBase dataset.

Introducing Tellusant’s Water Intake Calculator
January 23, 2023
Tellusant often works with beverage companies covering categories from bottled water to beer. A fundamental metric to quantify when analyzing market growth is how much water the human body needs. We have therefore developed the Tellusant Water Intake Calculator.