Characteristics of Inflation (1/5)
- 2022-06-16
- 7:53 pm
- Posted By: Tellusant

In part 1 of our five-part series on inflation, we review how inflation is measured in a consumer price index, how it differs between countries, and the current level of inflation.
This serves a background to the following four parts that look increasingly at inflation from a managerial perspective.
Definitions
Inflation is the rate of change in price levels. That is, it is the first derivative of price level = d(price level)/dt (and should be seen as a velocity).
If inflation is increasing or decreasing, we have acceleration or deceleration of price levels. That is, change in inflation = d(inflation)/dt = d²(price level)/dt².
Inflation is usually measured as changes in consumer price index (CPI). This typically covers urban consumer spending. A wider definition is the GDP deflator that covers the entire economy.
CPI has the advantage of being available quickly. The GDP deflator is a better measure though, especially in countries where urban consumers are not reflective of the national picture.
Inflation metrics
Inflation is usually positive, prices are increasing. 0–3% can be said to be normal, 3–6% is high, and above 6% is troublesome.
The graph below shows U.S. inflation since 1970.

As can be seen, current inflation is troublesome and only two earlier periods have exceeded today’s inflation. Those two periods live in infamy, so what we see now is a failure by policy makers.
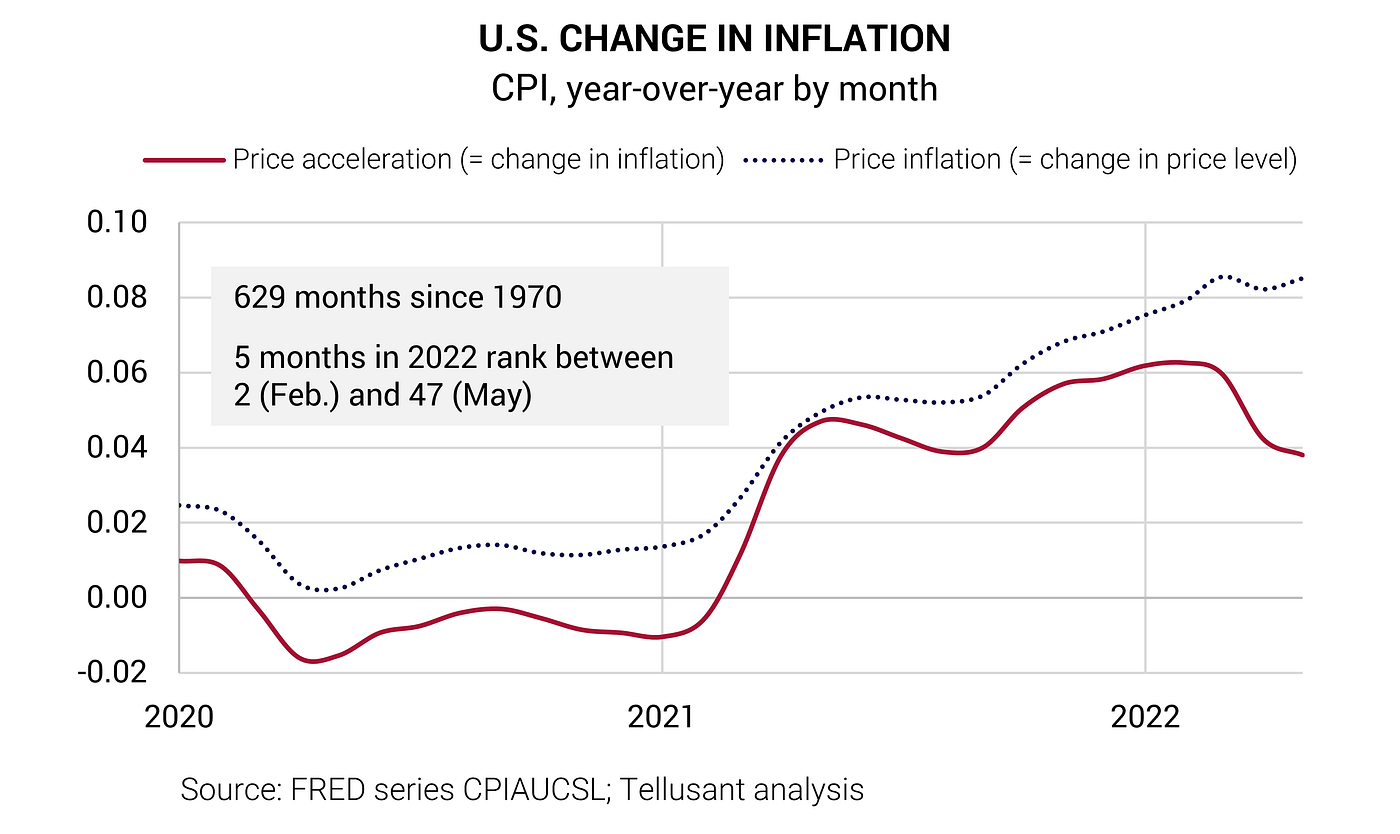
The change in inflation is also of interest (i.e., the acceleration of price levels). The graph below shows acceleration since 2020 with inflation added as a dotted line. Note that acceleration is not measured in percent.

Acceleration has been exceptionally high so far this year. While May looks better than February, the five months of this year are in the top 8% of months since 1970.
There is therefore no signal that inflation is under control and abating.
International comparison
What about the global picture? The graph below shows the 10 largest economies (Russia excluded). Inflation varies widely and there is nothing suggesting that every country will be affected.

The OECD also publishes an inflation forecast and for most of the high inflation countries above, inflation will be in the 5–10% range by end of 2023.
Components of CPI
Finally, this introductory article looks into what is inflating. We hear much about food and gasoline, but what are the other components of CPI (these other components are called Core CPI).
CPI is globally standardized around the COIPOC framework. It has 12 divisions¹ (global average weight in parentheses):
- Housing and utilities (25%)
- Food (22%)
- Transport (11%)
- HORECA² (6%)
- Recreation (6%)
- Clothing (6%)
- Furnishings and household items (5%)
- Health (4%)
- Communications (4%)
- Education (3%)
- Alcoholic beverages and tobacco (3%)
- Miscellaneous (5%)
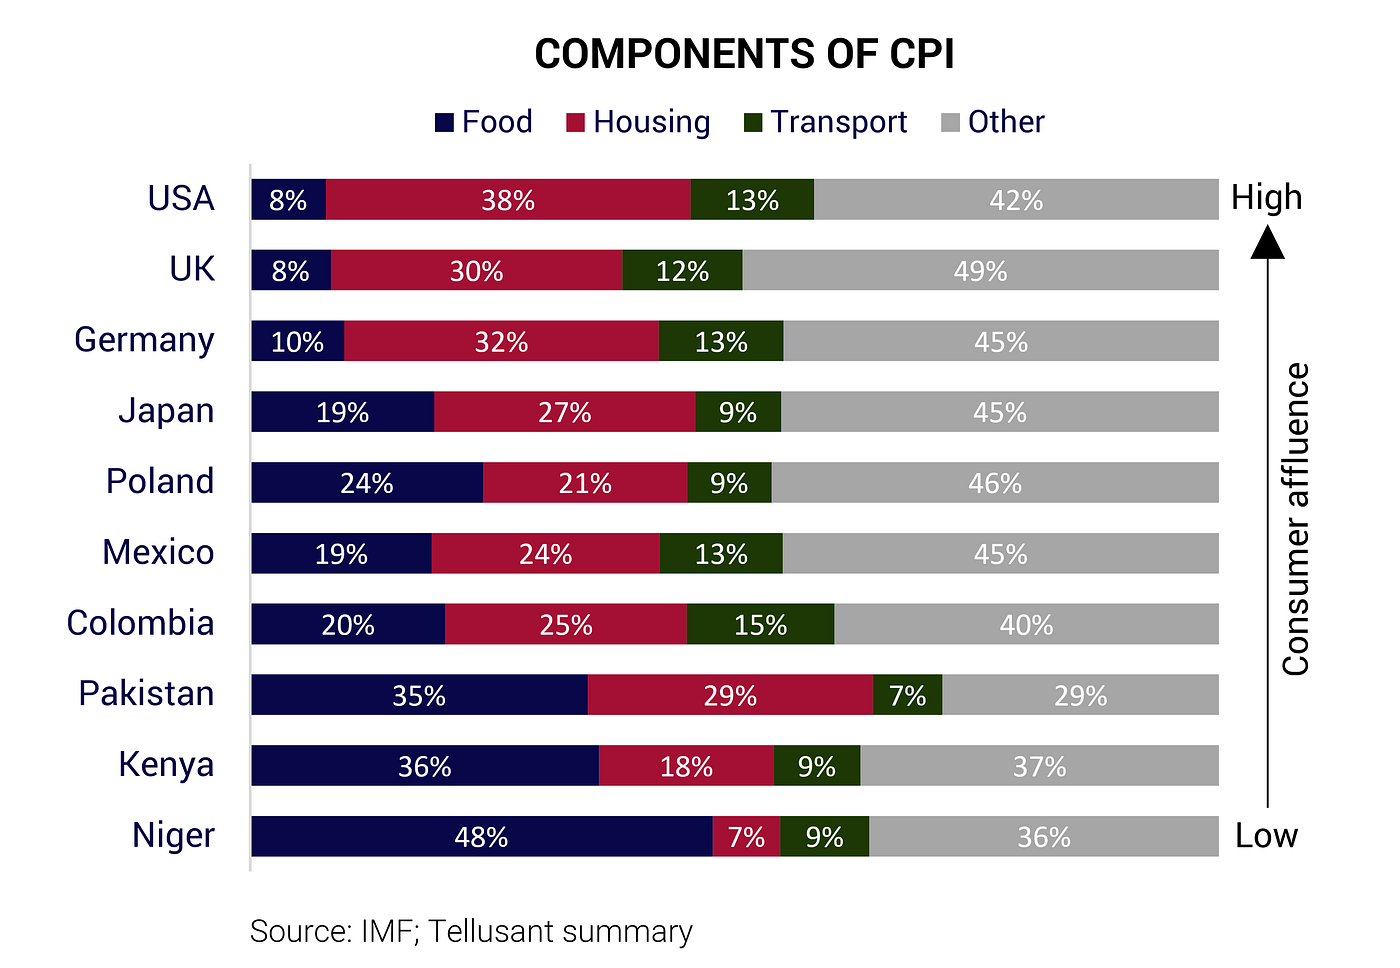
Weights by country vary widely as seen in the graph below.

Poor countries spend much on food. Rich countries spend relatively less on food (but more in absolute terms). Housing is instead the largest CPI division.
Gasoline is a small part in all countries. It is a subdivision of transport. In the U.S., gasoline is only 3% of consumer spending (or 20% of the transport division). The reason it is discussed so much is that it is easy to understand. Any citizen can benchmark gasoline prices. This is impossible for most people when it comes to complex divisions like education or health care.
The mix of the divisions in each country has major implications on consumers’ reaction to high inflation. We will return to this topic.
This overview of inflation is a springboard for the later part of this series. Next, we will show what drives inflation. We focus on the U.S. but there are global implications.
Tellusant’s expertise and suite of products help companies handle high inflation effectively. To learn more, contact us by filling out this online form.
¹ Called ‘divisions’ for unknown reason
² Hotels, restaurants and canteens