Tellusant Resources
We publish leading-edge insights and thoughts about management science, strategy development, strategic forecasting, urban and rural economics, and more.

Do you know who, where, and when your consumers are buying your products? Globally? By city? In 2027?

A company is more than management and technicalities. It is art as well. However, most companies wade through time with a dull sheen, without a thought to what makes humanity grand.

The most important decisions in times of high inflation are pricing related. Here we describe methods for how companies should optimize pricing…

We summarize some of our projects with cases studies. They quickly give an impression of who we work for, why we are engaged, and what we do.

How has consumer demand been impacted by price increases? Have those price increases been above inflation? Read our latest white paper which removes the haziness.

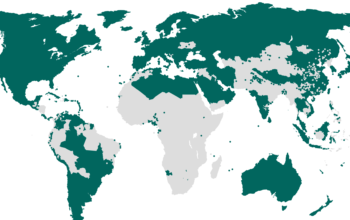
We provide free TelluBase data to select public data sources.These are small, but important, subsets of the full product.

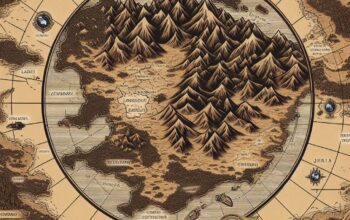
Tellusant generates an immense number of maps for our cloud-based apps. Here are some useful examples.

We use Microsoft Sway to create punchy, cross-platform presentations. They are typically for introducing a topic without too much detail.

This video shows how the global middle class evolves from 2000 till 2040. It is based on our TelluBase dataset.